
Pipeline#
Overview#
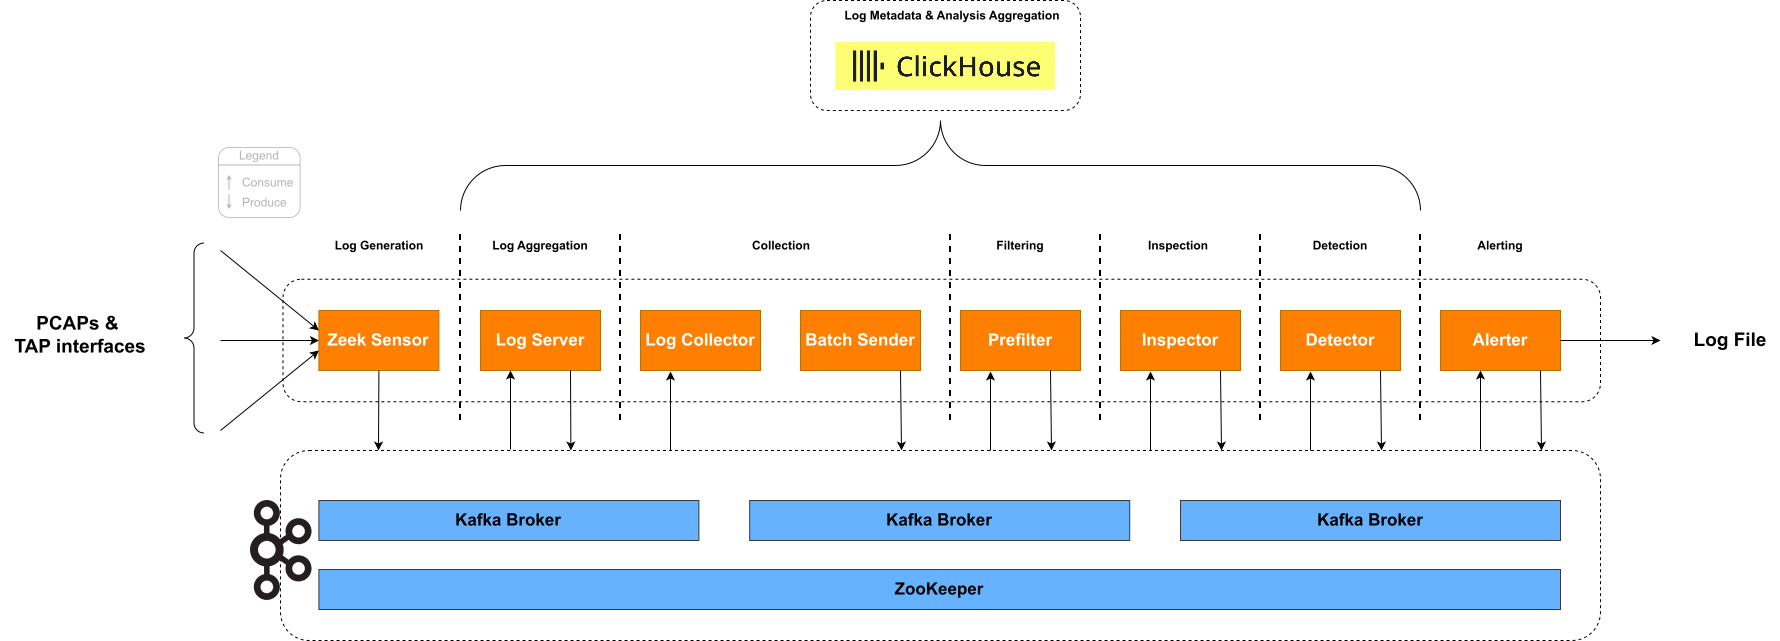
The core component of the software’s architecture is its data pipeline. It consists of five stages/modules, and data traverses through it using Apache Kafka.
Stage 1: Log Aggregation#
The Log Aggregation stage harnesses multiple Zeek sensors to ingest data from static (i.e. PCAP files) and dynamic sources (i.e. traffic from network interfaces). The traffic is split protocolwise into Kafka topics and send to the Logserver for the Log Storage phase.
Overview#
The ZeekConfigurationHandler takes care of the setup of a containerized Zeek sensor. It reads in the main configuration file and
adjusts the protocols to listen on, the logformats of incoming traffic, and the Kafka queues to send to.
The ZeekAnalysisHandler starts the actual Zeek instance. Based on the configuration it either starts Zeek in a cluster for specified network interfaces
or in a single node instance for static analyses.
Main Classes#
- class src.zeek.zeek_config_handler.ZeekConfigurationHandler#
- class src.zeek.zeek_analysis_handler.ZeekAnalysisHandler#
Usage and configuration#
An analysis can be performed via tapping network inerfaces and by injecting pcap files.
To adjust this, adapt the pipeline.zeek.sensors.[sensor_name].static_analysis value to True or false.
``pipeline.zeek.sensors.[sensor_name].static_analysis`` set to True:
An static analysis is executed. The PCAP files are extracted from within the GitHub root directory under
/data/test_pcaps"and mounted into the zeek container. All files ending in .PCAP are then read and analyzed by Zeek. Please Note that we do not recommend to use several Zeek instances for a static analysis, as the data will be read in multiple times, which impacts the benchmarks accordingly.
``pipeline.zeek.sensors.[sensor_name].static_analysis`` set to False:
A network analysis is performed for the interfaces listed in
pipeline.zeek.sensors.[sensor_name].interfaces
You can start multiple instances of Zeek by adding more entries to the dictionary pipeline.zeek.sensors.
Necessary attributes are:
- pipeline.zeek.sensors.[sensor_name].static_analysis : bool
- if not static analysis: pipeline.zeek.sensors.[sensor_name].interfaces : list
- pipeline.zeek.sensors.[sensor_name].protocols : list
Stage 2: Log Storage#
This stage serves as the central ingestion point for all data.
Overview#
The LogServer class is the core component of this stage. It reads the Zeek Sensors inputs and directs them via Kafka to the following stages.
Main Class#
- class src.logserver.server.LogServer(consume_topic, produce_topics)[source]#
Main component of the Log Storage stage to enter data into the pipeline
Receives and sends single log lines. Simultaneously, listens for messages via Kafka and reads newly added lines from an input file. Sends every log line to a Kafka topic under which it is obtained by the next stage.
Usage and configuration#
Currently, the LogServer reads from the Kafka Queues specified by Zeek. These have a common prefix, specified in environment.kafka_topics_prefix.pipeline.logserver_in. The suffix is the protocol name in lower case of the traffic.
The Logserver has no further configuration.
The LogServer simultaneously listens on a Kafka topic and reads from an input file. The configuration
allows changing the Kafka topic to listen on, as well as the file name to read from.
The Kafka topic to listen on takes input by Zeek. The traffic is split protocolwise, thus there are severa topics to listen to.
These have a common prefix, specified in environment.kafka_topics_prefix.pipeline.logserver_in. The suffix is the protocol name in lower case of the traffic.
Stage 3: Log Collection#
The Log Collection stage validates and processes incoming loglines from the Log Storage stage, organizes them into batches based on subnet IDs, and forwards them to the next pipeline stage for further analysis.
Core Functionality#
The Log Collection stage is responsible for retrieving loglines from the Log Storage, parsing their information fields, and validating the data. Each field is checked to ensure it is of the correct type and format. This stage ensures that all data is accurate, reducing the need for further verification in subsequent stages.
Data Processing and Validation#
Any loglines that do not meet the required format are immediately discarded to maintain data integrity. The validation process includes data type verification and value range checks (e.g., verifying that IP addresses are valid). Only validated loglines proceed to the batching phase.
Batching and Performance Optimization#
Valid loglines are buffered and transmitted in batches after a pre-defined timeout or when the buffer reaches its
capacity. This minimizes the number of messages sent to the next stage and optimizes performance. The client’s IP
address is retrieved from the logline and used to create the subnet_id with the number of subnet bits specified
in the configuration.
Advanced Features#
The functionality of the buffer system is detailed in the subsection Buffer Functionality. This approach helps detect errors or attacks that may occur at the boundary between two batches when analyzed in later pipeline stages.
Overview#
The Log Collection stage comprises three main classes:
LogCollector: Connects to theLogServerto retrieve and parse loglines, validating their format and content. Addssubnet_idthat it retrieves from the client’s IP address in the logline.BufferedBatch: Buffers validated loglines with respect to theirsubnet_id. Maintains the timestamps for accurate processing and analysis per key (subnet_id). Returns sorted batches.BufferedBatchSender: Adds messages to the data structureBufferedBatch, maintains the timer and checks the fill level of the key-specific batches. Sends the key’s batches if full, sends all batches at timeout.
Main Classes#
- class src.logcollector.collector.LogCollector(collector_name, protocol, consume_topic, produce_topics, validation_config)[source]#
Main component of the Log Collection stage to pre-process and format data
Consumes incoming loglines from the LogServer. Validates all data fields by type and value, invalid loglines are discarded. All valid loglines are sent to the BatchSender.
- class src.logcollector.batch_handler.BufferedBatch(collector_name, monitoring_kafka_producer=None)[source]#
Data structure for managing batches, buffers, and timestamps in the log collection pipeline
Manages two data structures: a current batch that collects incoming messages and a buffer that stores previously processed batch messages. The batch groups messages by key (typically subnet ID) and handles automatic sending when size or timeout limits are reached. All batches are sorted by timestamp to ensure chronological processing. Tracks batch metadata including IDs, timestamps, and fill levels for monitoring.
- class src.logcollector.batch_handler.BufferedBatchSender(produce_topics, collector_name, monitoring_kafka_producer=None, use_timer=True)[source]#
Main component for managing batch collection and dispatch in the log collection stage
Coordinates the addition of messages to batches and handles automatic sending based on two triggers: size-based (when a batch reaches the configured size limit) or time-based (when a timeout expires). Manages a timer that ensures batches are sent even if they don’t reach the size threshold, preventing data from being held indefinitely. Sends completed batches to the next pipeline stage via Kafka and tracks message timestamps for monitoring and debugging purposes.
Usage#
LogCollector#
The LogCollector connects to the LogServer to retrieve one logline, which it then processes and
validates. The logline is parsed into its respective fields, each checked for correct type and format.
For each configuration of a logg collector in pipeline.logcollection.collectors, a process is spun up in the resulting docker container
allowing for multiprocessing and threading.
Field Validation:
Checks include data type verification and value range checks (e.g., verifying that an IP address is valid).
Only loglines meeting the criteria are forwarded to the
BufferedBatchSender.
Subnet Identification:
The configuration file specifies the number n of bits in a subnet (e.g. 24). The client’s IP address serves as a base for the
subnet_id. For this, the initial IP address is cut off after n bits, the rest is filled with zeros, and_nis added to the end of thesubnet_id. For example:Client IP address
Subnet ID
171.154.4.17171.154.4.0_24
Connection to LogServer:
The
LogCollectorestablishes a connection to theLogServerand retrieves loglines when they become available.
Log Line Format:
As the log information differs for each protocol, there is a default format per protocol. This can be either adapted or a completely new one can be added as well. For more information please reffer to the Logline format configuration page.
DNS default logline format

TS STATUS SRC_IP DNS_IP HOST_DOMAIN_NAME RECORD_TYPE RESPONSE_IP SIZE
Field
Description
TSThe date and time when the log entry was recorded. Formatted as
YYYY-MM-DDTHH:MM:SS.sssZ.Default Format:
%Y-%m-%dT%H:%M:%S.%fZ(ISO 8601 with microseconds and UTC).Example:
2024-07-28T14:45:30.123456Z
The format can be customized by modifying the timestamp configuration in the pipeline configuration file.
STATUSThe status of the DNS query, e.g.,
NOERROR,NXDOMAIN.SRC_IP| The IP address of the client that made the- request.
DNS_IPThe IP address of the DNS server processing the request.
HOST_DOMAIN_NAMEThe domain name being queried.
RECORD_TYPEThe type of DNS record requested, such as
AorAAAA.RESPONSE_IPThe IP address returned in the DNS response.
SIZEThe size of the DNS query response in bytes. Represented in the format like
150b, where the number indicates the size andbdenotes bytes.HTTP default logline format TS SRC_IP SRC_PORT DST_IP DST_PORT METHOD URI STATUS_CODE REQUEST_BODY RESPONSE_BODY
Field
Description
TS| The date and time when the log entry was- recorded. Formatted as
YYYY-MM-DDTHH:MM:SS.sssZ.- Format:%Y-%m-%dT%H:%M:%S.%f(withmicroseconds truncated to milliseconds).- Time Zone:Zindicates Zulu time (UTC).- Example:2024-07-28T14:45:30.123ZThis format closely resembles ISO 8601, withmilliseconds precision.
SRC_IPThe IP address of the client that made the request.
SRC_PORTThe source port of the cliend making the request
DST_IPThe IP address of the target server for the request.
DST_PORTThe port of the target server
METHODThe HTTP method used (e.g.
GET, POST)URIPath accessed in the request (e.g.
/admin)STATUS_CODEThe HTTP status code returned (e.g.
500)REQUEST_BODYThe HTTP request payload (might be encrypted)
RESPONSE_BODYThe HTTP response body (might be encrypted)
BufferedBatch#
The BufferedBatch manages the buffering of validated loglines as well as their timestamps and batch metadata:
Batching Logic and Buffering Strategy:
Collects log entries into a
batchdictionary, with thesubnet_idas key.Uses a
bufferper key to concatenate and send both the current and previous batches together.This approach helps detect errors or attacks that may occur at the boundary between two batches when analyzed in Data-Inspection and Data-Analysis.
All batches get sorted by their timestamps at completion to ensure correct chronological order.
A begin_timestamp and end_timestamp per key are extracted and sent as metadata (needed for analysis). These are taken from the chronologically first and last message in a batch.
Tracks batch IDs, timestamps, and fill levels for comprehensive monitoring and debugging.
Monitoring and Metadata:
Each batch is assigned a unique batch ID for tracking purposes.
Logs associations between loglines and their respective batches.
Maintains fill level statistics for both batches and buffers.
Records batch status changes (waiting, completed) with timestamps.
BufferedBatchSender#
The BufferedBatchSender manages the sending of validated loglines stored in the BufferedBatch:
Timer-based and Size-based Triggers:
Starts a timer upon receiving the first log entry.
When a batch reaches the configured size (e.g., 1000 entries), the current and previous batches of this key are concatenated and sent to the Kafka topic
batch_sender_to_prefilter.Upon timer expiration, the currently stored batches of all keys are sent. Serves as backup if batches don’t reach the configured size.
If no messages are present when the timer expires, nothing is sent.
Message Processing and Monitoring:
Extracts logline IDs from JSON messages for tracking purposes.
Logs processing timestamps (in_process, batched) for each message.
Provides detailed logging about the number of messages and batches sent.
Uses the Batch schema for serialization before sending to Kafka.
Configuration#
The instances of the class LogCollector check the validity of incoming loglines. For this, they use the required_log_information configured
in the config.yaml.
Configurations can arbitrarily added, adjusted and removed. This is especially useful if certain detectors need specialized log fields. The following convention needs to be sticked to:
Each entry in the
required_log_informationneeds to be a listThe first item is the name of the datafield as adjusted in Zeek
The second item is the Class name the value should be mapped to for validation
Depending on the class, the third item is a list of valid inputs
Depending on the class, the fourth item is a list of relevant inputs
Buffer Functionality#
The BufferedBatch class manages the batching and buffering of messages associated with specific keys, along
with the corresponding timestamps. The class ensures efficient data processing by maintaining two sets of messages -
those currently being batched and those that were part of the previous batch. It also tracks the necessary timestamps
to manage the timing of message processing.
Class Overview#
Batch: Stores the latest incoming messages associated with a particular key.
Buffer: Stores the previous batch of messages associated with a particular key.
Batch ID: Unique identifier assigned to each batch for tracking and monitoring purposes.
Monitoring Databases: Tracks logline-to-batch associations, batch timestamps, and fill levels for comprehensive monitoring.
Key Procedures#
Message Arrival and Addition:
When a new message arrives, the
add_message()method is called.If the key already exists in the batch, the message is appended to the list of messages for that key.
If the key does not exist, a new entry is created in the batch with a unique batch ID.
Batch timestamps and logline-to-batch associations are logged for monitoring.
Example:
message_1arrives forkey_1and is added tobatch["key_1"].
Retrieving Message Counts:
Use
get_message_count_for_batch_key(key)to get the count of messages in the current batch for a specific key.Use
get_message_count_for_buffer_key(key)to get the count of messages in the buffer for a specific key.Use
get_message_count_for_batch()to get the total count across all batches.Use
get_message_count_for_buffer()to get the total count across all buffers.
Completing a Batch:
The
complete_batch()method is called to finalize and retrieve the batch data for a specific key.Scenarios:
Variant 1: If only the current batch contains messages (buffer is empty), the batch is returned sorted by and with its timestamps.
begin_timestampreflects the timestamp of the first message in the batch, andend_timestampthe timestamp of the chronologically last message in the batch.Variant 2: If both the batch and buffer contain messages, the buffered messages are included in the returned data. The
begin_timestampnow reflects the first message’s timestamp in the buffer instead of the batch.Variant 3: If only the buffer contains messages (no new messages arrived), the buffer data is discarded.
Variant 4: If neither the batch nor the buffer contains messages, a
ValueErroris raised.
Managing Stored Keys:
The
get_stored_keys()method returns a set of all keys currently stored in either the batch or the buffer, allowing the retrieval of all keys with associated messages or buffered data.
Example Workflow#
Initial Message:
message_1arrives forkey_1, added tobatch["key_1"].
Subsequent Message:
message_2arrives forkey_1, added tobatch["key_1"].
Completing the Batch:
complete_batch("key_1")is called, and ifbuffer["key_1"]exists, it includes both buffered and batch messages, otherwise just the batch.The current batch is moved to the buffer.
Buffer Management:
If no new messages arrive,
buffer["key_1"]data is discarded upon the next call tocomplete_batch("key_1").
This class design effectively manages the batching and buffering of messages, allowing for precise timestamp tracking and efficient data processing across different message streams.
Stage 4: Log Filtering#
The Log Filtering stage processes batches from the Log Collection stage and filters out irrelevant entries based on configurable relevance criteria, ensuring only meaningful data proceeds to anomaly detection.
Core Functionality#
The Log Filtering stage is responsible for processing and refining log data by filtering out entries based on relevance criteria defined in the logline format configuration. This step ensures that only relevant logs are passed on for further analysis, optimizing the performance and accuracy of subsequent pipeline stages.
Data Processing Pipeline#
The filtering process operates on complete batches rather than individual loglines, maintaining batch metadata and timestamps throughout the process. Each batch is processed as a unit, preserving the subnet-based grouping established in the previous stage.
Relevance-Based Filtering#
The filtering mechanism uses the check_relevance() method from the LoglineHandler to determine which
entries should proceed to the next stage. This approach allows for flexible filtering criteria based on field values
defined in the configuration.
Main Class#
- class src.prefilter.prefilter.Prefilter(validation_config, consume_topic, produce_topics, relevance_function_name)[source]#
Main component of the Log Filtering stage to process and filter batches
Consumes batches from the Log Collection stage and applies relevance-based filtering using the
LoglineHandler. Filters out irrelevant loglines and forwards only relevant data to the next pipeline stage for anomaly detection.
Usage#
One Prefilter per prefilter configuration in pipeline.log_filtering is started. Each instance loads from a Kafka topic name that depends on the logcollector the prefilter builds upon.
The prefix for each topic is defined in environment.kafka_topics_prefix.batch_sender_to_prefilter. and the suffix is the configured log collector name.
The prefilters extract the log entries and apply a filter function (or relevance function) to retain only those entries that match the specified requirements.
Data Flow and Processing#
The Prefilter consumes batches from the Kafka topic batch_sender_to_prefilter and processes them through
the following workflow:
Batch Reception: Receives complete batches with metadata (batch_id, begin_timestamp, end_timestamp, subnet_id)
Relevance Filtering: Applies relevance checks to each logline within the batch
Monitoring: Tracks filtered and unfiltered data counts for monitoring purposes
Batch Forwarding: Sends filtered batches to the
prefilter_to_inspectortopic
Filtering Logic#
The filtering process:
Retains loglines that pass the relevance check defined by
ListItemfield configurationsDiscards irrelevant loglines and marks them as “filtered_out” in the monitoring system
Preserves batch structure and metadata for filtered data
Handles empty batches gracefully (logs info but does not forward empty data)
Error Handling#
The implementation includes robust error handling:
Empty Data: Logs informational messages when batches contain no data
No Filtered Data: Raises
ValueErrorwhen no relevant data remains after filteringKafka Exceptions: Continues processing on message fetch exceptions
Graceful Shutdown: Supports
KeyboardInterruptfor clean termination
Configuration#
To customize the filtering behavior, the relevance function can be extended and adjusted in "src/base/logline_handler" and can be referenced in the "configuration.yaml" by the function name.
Checks can be skipped by referencing the no_relevance_check function.
We currently support the following relevance methods:
Name
Description
no_relevance_checkSkip the relevance check of the prefilters entirely.
check_dga_relevanceFunction to filter requests based on LisItems in the logcollector configuration. Using the fourth item in the list as a list of relevant status codes, only the request and responses are forwarded that include a NXDOMAIN status code.
check_domainator_relevancePublic-suffix-aware Domainator filter. Only DNS names with at least one label above the registrable domain are forwarded.
api.amazon.co.ukpasses;amazon.co.ukandgoogle.comare filtered out.
Example Configuration:
logline_format:
  - [ "status_code", ListItem, [ "NOERROR", "NXDOMAIN" ], [ "NXDOMAIN" ] ]  # Only NXDOMAIN relevant
  - [ "record_type", ListItem, [ "A", "AAAA" ] ]  # A and AAAA relevant
Monitoring and Metrics#
The Prefilter provides comprehensive monitoring:
Batch Processing: Tracks batch timestamps and processing status
Fill Levels: Monitors data volumes before and after filtering
Logline Tracking: Records “filtered_out” status for individual loglines
Performance Metrics: Logs processing statistics for each batch
Stage 5: Inspection#
Overview#
The Inspector stage is responsible to run time-series based anomaly detection on prefiltered batches. This stage is essential to reduce the load on the Detection stage. Otherwise, resource complexity increases disproportionately.
Main Classes#
- class src.inspector.inspector.InspectorBase(consume_topic, produce_topics, config)[source]#
Finds anomalies in a batch of requests and produces it to the
Detector.
The InspectorBase is the primary class for inspecotrs. It holds common functionalities and is responsible for data ingesting, sending, etc.. Any inspector build on top of this
class and needs to implement the methods specified by InspectorAbstractBase. The class implementations need to go into "/src/inspector/plugins"
Usage and Configuration#
We currently support the following inspectors:
Name |
Description |
Configuration |
|---|---|---|
|
Skip the anomaly inspection of data entirely. |
No additional configuration |
|
Uses StreamAD models for anomaly detection. All StreamAD models are supported (univariate, multivariate, ensembles). |
|
Further inspectors can be added and referenced in the config by adjusting the pipeline.data_inspection.[inspector].inspector_module_name and pipeline.data_inspection.[inspector].inspector_class_name.
Each inspector might need special configurations. For the possible configuration values, please reference the table above.
StreamAD Inspector#
The inspector consumes batches on the topic inspect, usually produced by the Prefilter.
For a new batch, it derives the timestamps begin_timestamp and end_timestamp.
Based on time type (e.g. s, ms) and time range (e.g. 5) the sliding non-overlapping window is created.
For univariate time-series, it counts the number of occurances, whereas for multivariate, it considers the number of occurances and packet size. [Schüppen et al., 2018]
An anomaly is noted when it is greater than a score_threshold.
In addition, we support a relative anomaly threshold.
So, if the anomaly threshold is 0.01, it sends anomalies for further detection, if the amount of anomalies divided by the total amount of requests in the batch is greater than 0.01.
Time Series Feature Extraction#
The Inspector creates time series features using sliding non-overlapping windows:
Time Window Configuration: Based on
time_type(e.g.,ms) andtime_range(e.g.,20) from configurationUnivariate Mode: Counts message occurrences per time step for single-feature anomaly detection
Multivariate Mode: Combines message counts and mean packet sizes for two-dimensional feature analysis
Ensemble Mode: Uses message counts with multiple models combined through ensemble methods
Anomaly Detection Logic#
The anomaly detection process evaluates suspicious patterns through a two-level threshold system:
Score Threshold: Individual time steps are flagged as anomalous when scores exceed
score_threshold(default: 0.5)Anomaly Threshold: Batches are considered suspicious when the proportion of anomalous time steps exceeds
anomaly_threshold(default: 0.01)Client IP Grouping: Suspicious batches are grouped by client IP and forwarded as separate suspicious batches to the Detector
Error Handling and Monitoring#
The implementation includes comprehensive monitoring and error handling:
Busy State Management: Prevents new batch consumption while processing current data
Model Validation: Validates model compatibility with selected detection mode
Fill Level Tracking: Monitors data volumes throughout the processing pipeline
Graceful Degradation: Handles empty batches and model loading failures appropriately
Configuration#
The Inspector supports comprehensive configuration through the data_inspection.inspector section in config.yaml.
All StreamAD models are supported, including univariate, multivariate, and ensemble methods.
Detection Modes#
Three detection modes are available:
Univariate Mode (
mode: univariate): Uses message count time series for anomaly detectionMultivariate Mode (
mode: multivariate): Combines message counts and mean packet sizesEnsemble Mode (
mode: ensemble): Uses multiple models with ensemble combination methods
Model Configuration#
Univariate Models (streamad.model):
ZScoreDetector: Statistical anomaly detection using z-scoresKNNDetector: K-nearest neighbors based detectionSpotDetector: Streaming peaks-over-threshold detectionSRDetector: Spectral residual based detectionOCSVMDetector: One-class SVM for anomaly detectionMadDetector: Median absolute deviation detectionSArimaDetector: Streaming ARIMA-based detection
Multivariate Models (streamad.model):
xStreamDetector: Multi-dimensional streaming detectionRShashDetector: Random projection hash-based detectionHSTreeDetector: Half-space tree based detectionLodaDetector: Lightweight online detector of anomaliesOCSVMDetector: One-class SVM (supports multivariate)RrcfDetector: Robust random cut forest detection
Ensemble Methods (streamad.process):
WeightEnsemble: Weighted combination of multiple detectorsVoteEnsemble: Voting-based ensemble prediction
Configuration Parameters#
data_inspection:
  inspector:
    mode: univariate                    # Detection mode: univariate, multivariate, ensemble
    models:                             # List of models to use
      - model: ZScoreDetector
        module: streamad.model
        model_args:
          is_global: false
    ensemble:                           # Ensemble configuration (when mode: ensemble)
      model: WeightEnsemble
      module: streamad.process
      model_args: {}
    anomaly_threshold: 0.01            # Proportion of anomalous time steps required
    score_threshold: 0.5               # Individual score threshold for anomaly detection
    time_type: ms                      # Time unit for window creation
    time_range: 20                     # Time range for each window step
Model Arguments: Custom arguments for specific models can be provided via the model_args dictionary.
This allows fine-tuning of model parameters for specific deployment requirements.
Time Window Settings: The time_type and time_range parameters control the granularity of time series analysis.
Current configuration uses 20-millisecond windows for high-resolution anomaly detection.
Stage 6: Detection#
Overview#
The Detection stage is the core of the HAMSTRING pipeline. It consumes suspicious batches passed from the Inspector, applies pre-trained ML models to classify individual DNS requests, and issues alerts based on aggregated probabilities.
The pre-trained models used here are licensed under EUPL‑1.2 and built from the following datasets:
Main Classes#
- class src.detector.detector.DetectorAbstractBase(detector_config, consume_topic, produce_topics=None, downstream_detector_topics=None)[source]#
Abstract base class for all detector implementations.
This class defines the interface that all concrete detector implementations must follow. It provides the essential methods that need to be implemented for a detector to function within the pipeline.
Subclasses must implement all abstract methods to ensure proper integration with the detection system.
- class src.detector.detector.DetectorBase(detector_config, consume_topic, produce_topics=None, downstream_detector_topics=None)[source]#
Base implementation for detectors in the pipeline.
This class provides a concrete implementation of the detector interface with common functionality shared across all detector types. It handles model management, data processing, Kafka communication, and result reporting.
The class is designed to be extended by specific detector implementations that provide model-specific prediction logic.
- class src.detector.plugins.dga_detector.DGADetector(detector_config, consume_topic, produce_topics=None, downstream_detector_topics=None)[source]#
Detector implementation for identifying Domain Generation Algorithm (DGA) domains.
This class extends the DetectorBase to provide specific functionality for detecting malicious domains generated by domain generation algorithms. It uses a machine learning model to analyze domain name characteristics and identify potential DGA activity.
The detector extracts various statistical and structural features from domain names to make predictions about whether a domain is likely generated by a DGA.
- class src.detector.plugins.domainator_detector.DomainatorDetector(detector_config, consume_topic, produce_topics=None, downstream_detector_topics=None)[source]#
Detector implementation for identifying data exfiltration and command and control on the subdomain level.
This class extends the DetectorBase to provide specific functionality for detecting malicious queries. It analyzes subdomain similarity characteristics based on grouping of the queries in windows of fixed size, in order to identify potential data exfiltration or command and control.
The detector extracts various statistical similarity features from windows of subdomains to make predictions about whether a query is likely malicious.
- class src.detector.plugins.domainator_attributor.DomainatorAttributor(detector_config, consume_topic, produce_topics=None, downstream_detector_topics=None)[source]#
Detector implementation for the attribution of a tool or malware that was used in the data exfiltration and command and control, using the subdomain level labels.
This class extends the DetectorBase to provide specific functionality for identifying the tool sending the malicious queries. It analyzes subdomain similarity characteristics based on grouping of the queries in windows of fixed size, similar to the Domainator detector approach. It can be used both as a standalone detector or as a next stage in a pipeline of detectors, dependent on the provided model.
The identity detector extracts various statistical similarity features from windows of subdomains to make predictions about what tool likely sent the malicious query or what job/behaviour was observed.
The DetectorBase is the primary class for Detectors. It holds common functionalities and is responsible for data ingesting, triggering alerts, logging, etc.. Any Detector is build on top of this
class and needs to implement the methods specified by DetectorAbstractBase. The class implementations need to go into "/src/detector/plugins"
Usage#
A detector listens on the Kafka topic from the Inspector he is configured to.
For each suspicious batch: - Extracts features for every domain request. - Applies the loaded ML model (after scaling) to compute class probabilities. - Marks a request as malicious if its probability exceeds the configured threshold.
Computes an overall score (e.g. median of malicious probabilities) for the batch.
If malicious requests exist, issues an alert record and logs it; otherwise, the batch is filtered.
Alerts are recorded in ClickHouse and also appended to a local JSON file (warnings.json) for external monitoring.
Configuration#
You may use the provided, pre-trained models or supply your own. To use a custom model, specify:
name: unique name for the detector instance
base_url: URL from which to fetch model artifacts
model: model name
checksum: SHA256 digest for integrity validation
threshold: probability threshold for classifying a request as malicious
inspector_name: name of the inspector configuration for input. Omit this or set consume_from: detector when consuming from another detector.
consume_from: use detector to consume from the detector-to-detector topic for this detector instance
detector_module_name: name of the python module the implementation details reside
detector_class_name: name of the class in the python module to load the detector implementation details
produce_topics: (Optional) Comma-separated list of topic suffixes to produce alerts to. If left empty, alerts are sent to the
genericalerter topic. Use send_to_alerter: false or produce_topics: [] for intermediary detectors that should not produce to an alerter.next_detectors: (Optional) Comma-separated list of detector instance names that receive this detector’s suspicious output.
These parameters are loaded at startup and used to download, verify, and load the model/scaler if not already cached locally (in temp directory).
Detector Chaining#
Detector instances can be chained by setting next_detectors on the upstream detector and consume_from: detector on the downstream detector. Detector-to-detector topics use the naming pattern [detector_to_detector_prefix]-[detector_name].
For intermediary detectors that should only forward suspicious output to another detector, set send_to_alerter: false or produce_topics: [].
Domainator Detector Models#
The Domainator detection and attribution pipeline is divided into four model variants. They can be used as a multi-stage chain, where the binary detector forwards suspicious windows to attribution models, or as individual detectors when a deployment already has an upstream selection mechanism. The models use the same feature family and training data, but differ in their ground-truth labels and therefore in the task they solve: detection, tool identification, behavior analysis, or combined identification and behavior analysis.
The current Domainator model family was trained with a combination of real malware samples from Petrov et al. [Petrov et al., 2025], tunneling-tool datasets from Chen et al. [Chen et al., 2021] and Gao et al. [Gao et al., 2024], and benign DNS traffic from Žiža et al. [Žiža et al., 2023]. The feature extraction procedure follows Petrov et al. [Petrov et al., 2025]: HAMSTRING calculates features over the subdomain portions of DNS requests sent by the client or victim side of the conversation.
The shared feature set contains:
Levenshtein distance
Jaro similarity metric
Jaro-Winkler similarity metric
Jaro similarity metric on reversed strings
Jaro-Winkler similarity metric on reversed strings
Longest common string
Longest common substring
The pure detection model, 1779955108_SPRING-detector, classifies traffic as legitimate or malicious. The identification model, 1779955108_SPRING-attributor-identification, distinguishes between individual DNS tunneling tools or malware families. Unknown tools can therefore be misclassified as one of the known tools or labelled as legitimate. The combined identification and behavior model, 1779955108_SPRING-attributor-identification-behaviour, predicts both the tool and observed behavior, such as download, upload, or idle activity. Since this requires behavior-specific training labels, it supports a subset of the identification classes. The generalized behavior model, 1779955108_SPRING-attributor-behaviour, omits tool names from the labels and predicts only the behavior, which can help classify behavior from tools not present in the training data.
Model |
Classes |
|---|---|
|
|
|
|
|
|
|
|
Stage 7: Alerter#
Overview#
The Alerter stage is the final stage of the HAMSTRING pipeline. It serves as a central hub for all alerts generated by various detectors. Its primary role is to consolidate these alerts and perform configurable actions, such as logging to a local file or forwarding them to an external Kafka topic for further processing (e.g., SIEM integration).
The Alerter stage is designed to be highly flexible, allowing for custom “Alerter Plugins” to perform arbitrary workloads on the alert data before the final logging/forwarding actions are executed.
Core Functionality#
Alert Consumption: The Alerter stage runs multiple instances of alerters, each listening on a specific Kafka topic.
Topic Naming: By convention, the topics listened to by the Alerter stage follow the pattern:
[detector_to_alerter_prefix]-[suffix]where the prefix is defined in the environment configuration and the suffix is eithergenericor a specific name defined in a detector’sproduce_topicsconfiguration.Generic Topic: Detectors that do not specify a particular
produce_topicswill automatically route their alerts to thegenerictopic. A dedicatedGenericAlerterinstance consumes from this topic.Plugin Execution: For each alert received, the Alerter first passes the data through any configured plugins. Plugins can mutate the alert payload (e.g., adding metadata).
Base Actions: After plugin processing, the Alerter performs the “Base Actions” as configured: - Log to File: Appends the alert JSON to a local log file. - Log to Kafka: Forwards the alert to an external Kafka topic.
Main Classes#
- class src.alerter.alerter.AlerterBase(alerter_config, consume_topic)[source]#
Base implementation for Alerters in the pipeline.
This class handles the common logic for consuming alerts from Kafka, executing custom processing via plugins, and performing base actions like logging to a file or forwarding to an external Kafka topic.
- class src.alerter.plugins.generic_alerter.GenericAlerter(alerter_config, consume_topic)[source]#
Specific implementation for an Alerter that processes alerts from a generic topic.
It performs no additional processing or transformation by itself, instead relying solely on the base actions (logging to file/Kafka).
The AlerterBase provides the foundation for all alerter instances, handling the base logging and Kafka forwarding logic. Custom plugins should not necessarily inherit from it but are loaded dynamically by the framework.
Usage and Configuration#
The Alerter stage is configured globally in the pipeline.alerting section of config.yaml.
Base Configuration#
log_to_file: boolean, enables logging to a local file.log_to_kafka: boolean, enables forwarding to an external Kafka topic.log_file_path: path to the local log file (e.g.,/opt/logs/alerts.txt).external_kafka_topic: the name of the Kafka topic to forward alerts to (e.g.,hamstring_alerts).
Plugins#
Custom alerter plugins can be defined in the plugins list. Each plugin entry requires:
name: unique name for the plugin instance.alerter_module_name: name of the python module insrc/alerter/plugins/.alerter_class_name: name of the class to instantiate.
Example Plugin: HelloWorld Alerter#
The HelloWorldAlerter is a sample plugin that appends a simple “hello_world” field to every alert payload before it is logged or forwarded.
Supported Detectors Overview#
In case you want to load self-trained models, the configuration acn be adapted to load the model from a different location. Since download link is assembled the following way:
<model_base_url>/files/?p=%2F<model_name>/<model_checksum>/<model_name>.pickle&dl=1" You can adapt the base url. If you need to adhere to another URL composition create
A new detector class by either implementing the necessary base functions from DetectorBase or by deriving the new class from DGADetector and just overwrite the "get_model_download_url" method.
The following are already implemented detectors:
DGA Detector#
The DGADetector consumes anomalous batches of requests, preprocessed by the StreamAD library.
It calculates a probability score for each request, to find if a DGA DNS entry was queried.
Domainator Detector#
The DomainatorDetector consumes anomalous batches of requests.
It identifies potential data exfiltration and command & control on the subdomain level by analyzing characteristics of the subdomains.
Messages are grouped by domain into fixed-size windows to allow for sequential anomaly detection. The detector leverages machine learning based on statistical and linguistic features from the domain name
including label lengths, character frequencies, entropy measures, and counts of different character types across domain name levels.
Domainator Attributor#
The DomainatorAttributor uses the same subdomain-window feature extraction as the DomainatorDetector, but its labels describe the likely tool, malware family, behavior, or tool-behavior combination. It can run downstream of DomainatorDetector through detector chaining, or independently when its input already contains DNS windows that should be attributed.